Balancing of MSTR and STRC
Originally published on X
Related Research
“All models are wrong, some are useful.” George E.P. Box.
$MSTR Price Projection - A Mechanical Framework
Strategy’s long-term equity value is driven by one simple equation: Bitcoin per share. That number increases when Bitcoin accumulation outpaces share dilution.
The scenarios below simply test how different combinations of Bitcoin accumulation, share dilution, and Bitcoin price interact over time, using the same operating ranges Strategy has already demonstrated historically.
This is not a prediction. It’s a mechanical projection based on what Strategy has already demonstrated it can do.
Rather than guess where Bitcoin goes, the framework starts with the only variables Strategy actually controls:
- Bitcoin accumulation (BTC held)
- Share issuance (basic shares outstanding)
Everything else flows from those two numbers.
The core relationship is simple:
MSTR Price = mNAV × BTC Price × BTC per Share
And:
BTC per Share = BTC Held ÷ Basic Shares Outstanding
This means the long-term value of MSTR is determined by the interaction between how fast Strategy accumulates Bitcoin and how fast or slow the share count grows. These are the only metrics that Strategy controls, they do not control the price of MSTR or Bitcoin.
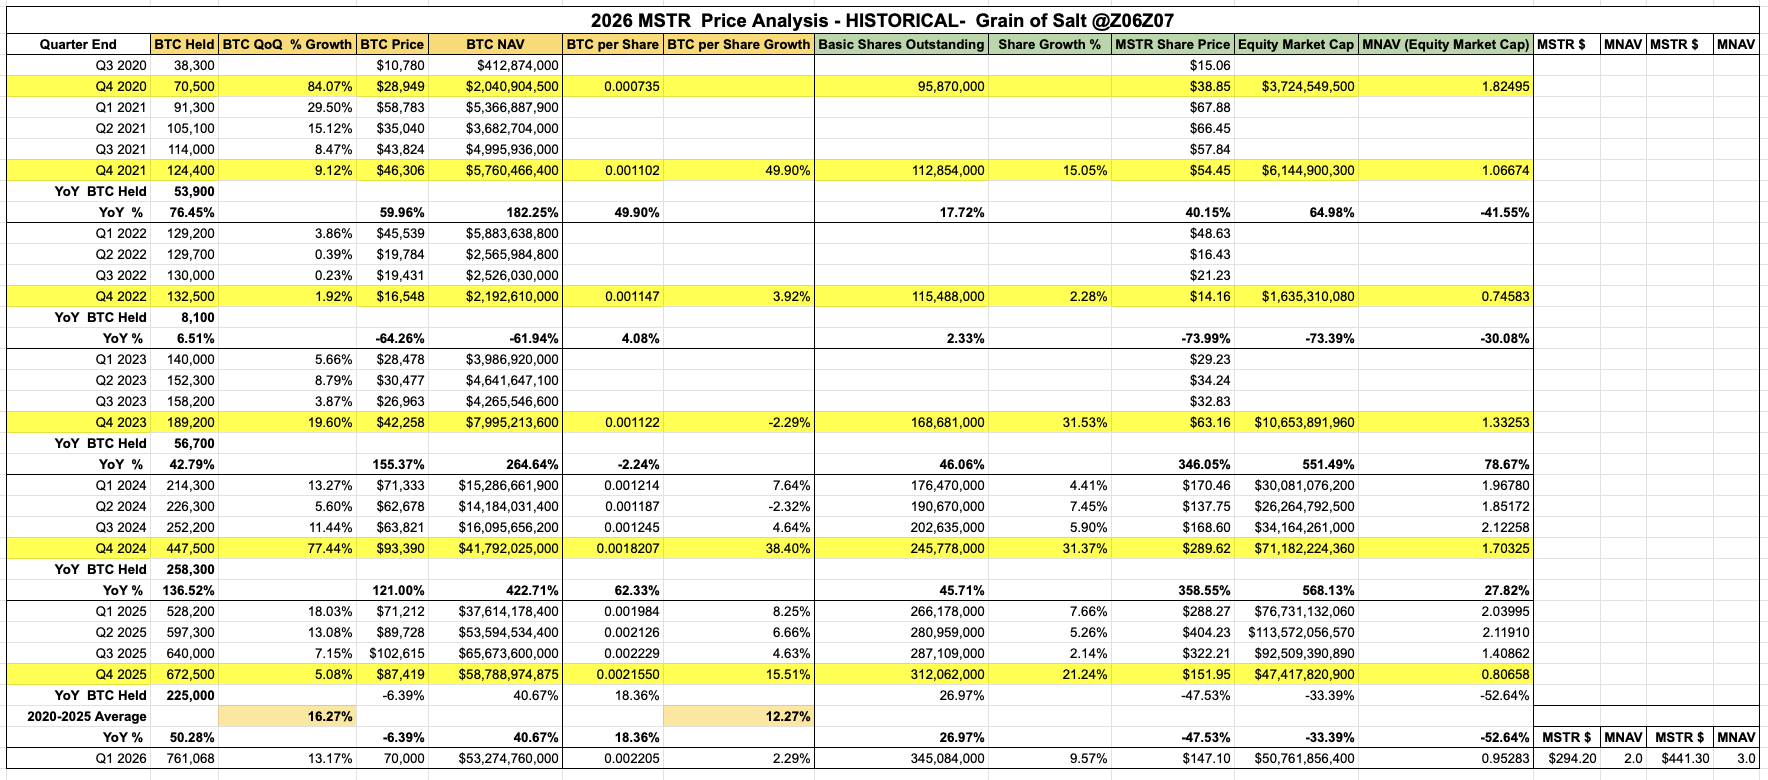
The historical table provides the baseline. From 2020 through 2025, Strategy averaged roughly:
- ~16% quarterly BTC growth
- ~11% quarterly share growth
Those two figures form the starting point for the projection scenarios.
The second table shows a structural shift that began appearing recently: the capital mix between MSTR common equity and $STRC preferred capital.

Across the sample period, funding breaks down roughly as:
- MSTR: ~58%
- STRC: ~42%
More importantly, recent weeks have moved closer to a 50/50 mix as STRC has risen to ~75% in the lastest ATM.
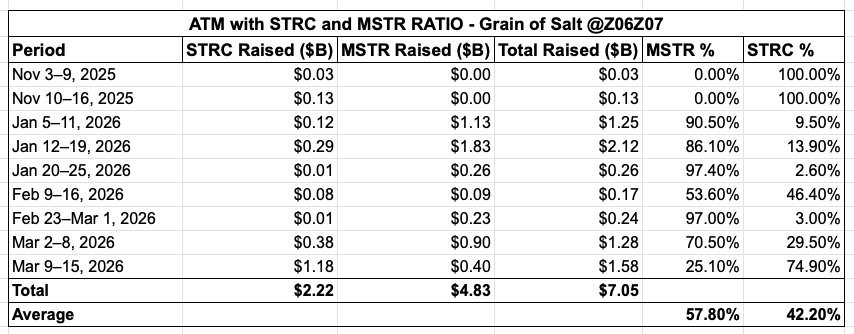
That matters because preferred issuance raises capital without increasing the basic shares outstanding count.
If roughly half of BTC purchases are funded by preferreds instead of common equity, dilution should logically fall.
Historically, share growth averaged about 11% per quarter.
Under a hybrid capital structure, dilution closer to 5.5**% per quarter** becomes plausible. The scenarios that follow simply explore how those variables interact.
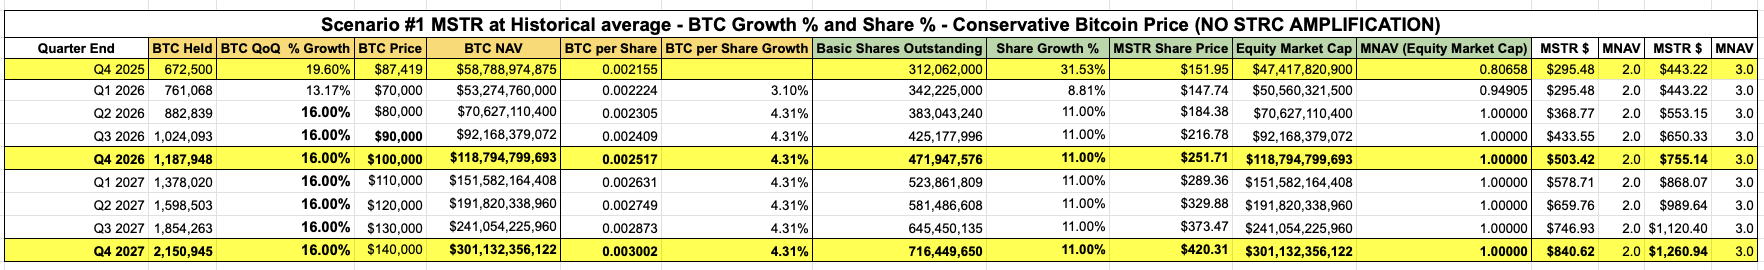
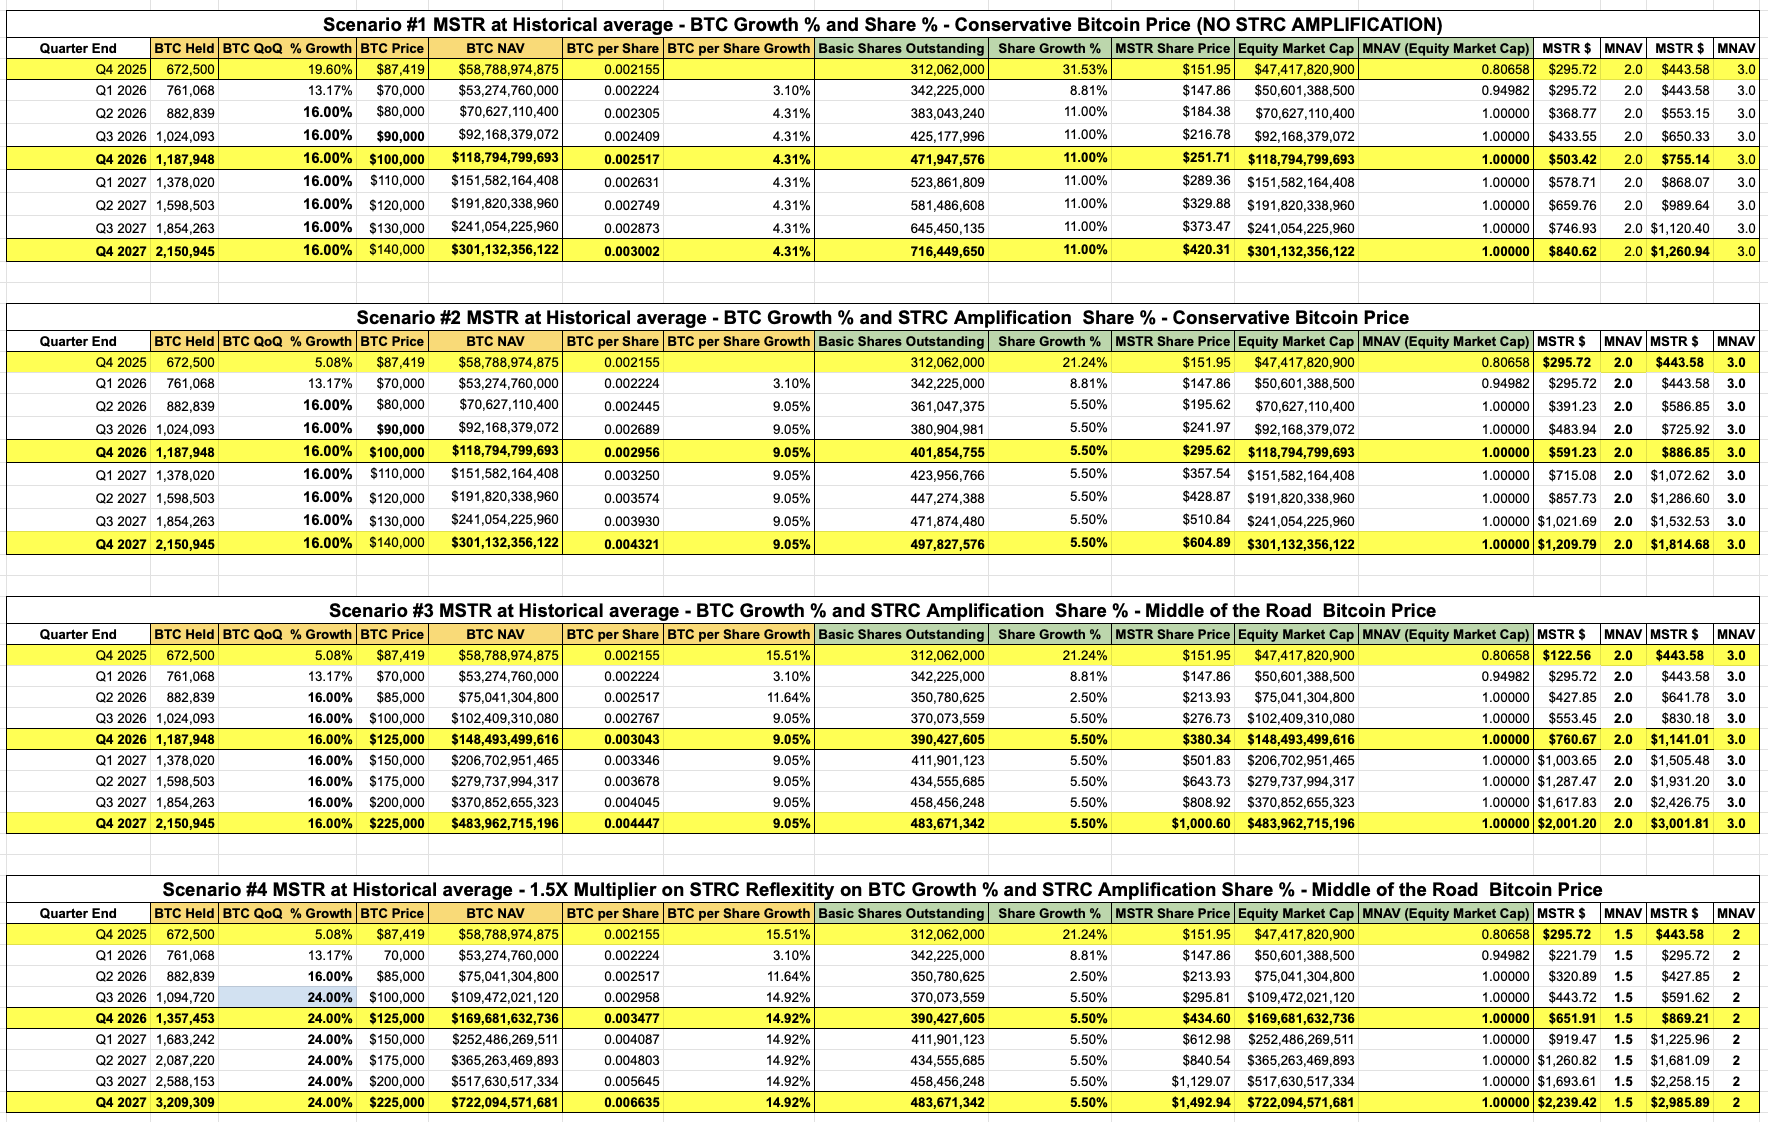
Scenario 1 - Historical Continuation
The first scenario assumes Strategy continues operating exactly within its historical averages.
BTC holdings grow roughly 16% per quarter, while the share count expands about 11% per quarter. Bitcoin follows a conservative price path that ends around $140k by 2027. Nothing new is assumed. No structural change. No preferred share amplification.
This scenario answers the most basic question:
If Strategy simply continues doing what it has already done for five years, where does that lead?
Because dilution and BTC accumulation grow at similar speeds, BTC per share increases steadily but moderately.
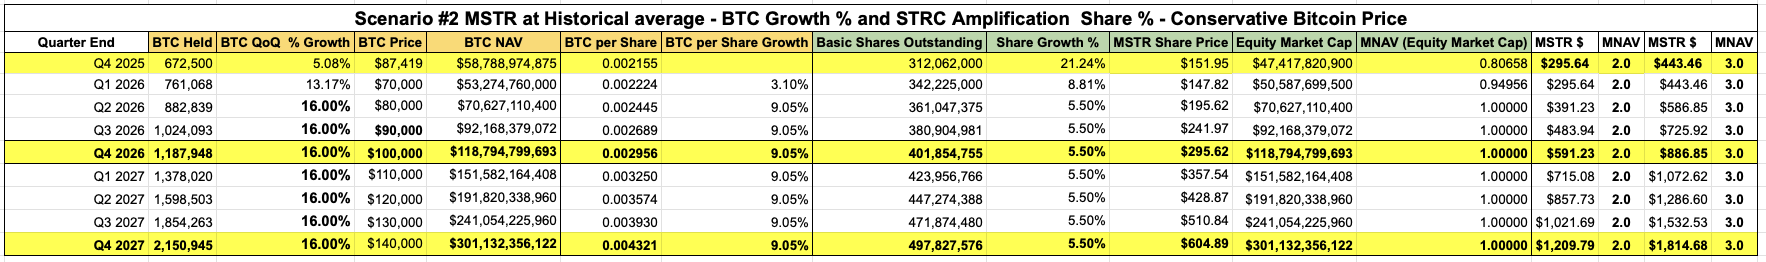
Scenario 2 - STRC Amplification
The second scenario introduces the structural change implied by the capital mix table.
Bitcoin accumulation continues at the same 16% quarterly growth rate. The difference is the share count. If roughly half of new capital comes from preferred shares rather than common equity, dilution falls from about 11% to 5.5% per quarter.
Nothing else changes. Bitcoin price remains identical to Scenario 1. But lowering dilution while maintaining the same BTC accumulation rate increases BTC per share growth significantly.
This is the mechanical effect of the hybrid capital structure.
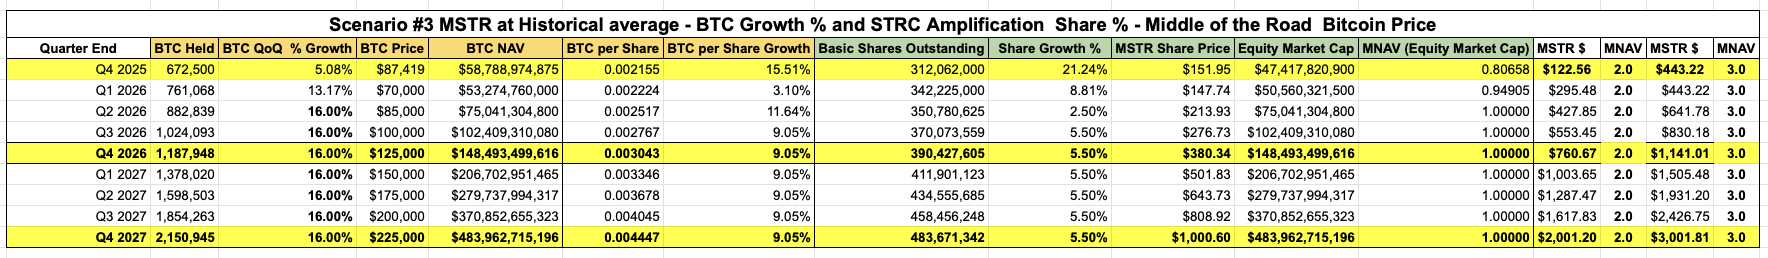
Scenario 3 - Higher Bitcoin Price
The third scenario keeps the exact same capital structure as Scenario 2.
BTC accumulation remains 16% quarterly growth. Share growth remains 5.5**%**.
The only change is the Bitcoin price path. Instead of ending near $140k, Bitcoin rises toward $225k by 2027. Strategy does not accumulate more Bitcoin in this scenario than in Scenario 2. The difference is simply the value of the Bitcoin already held.
This isolates the sensitivity of MSTR’s equity value to Bitcoin’s underlying price.
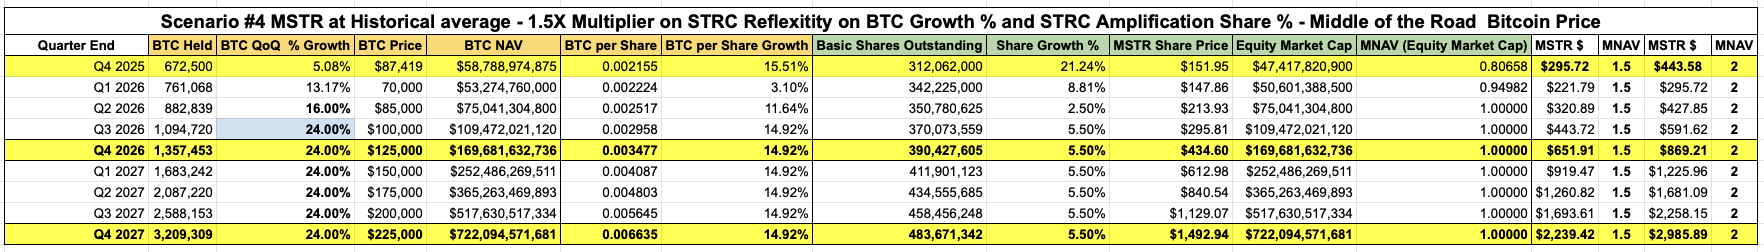
Scenario 4 - Reflexive Capital Formation
The final scenario introduces reflexivity.
Instead of assuming Strategy drives Bitcoin’s global price, the model assumes something simpler and historically observable: higher mNAV allows Strategy to raise more capital and purchase more Bitcoin.
Rather than applying a multiplier to Bitcoin’s price, the multiplier is applied to Bitcoin accumulation. BTC growth accelerates from 16% to 24% per quarter (a 1.5× increase), while share growth remains 5.5**%**. Bitcoin’s price path remains the same as in Scenario 3.
This reflects a scenario where Strategy’s access to capital improves as the balance sheet expands.
Historically, periods of elevated mNAV have coincided with larger capital raises and faster BTC purchases, making this assumption plausible without requiring Strategy to influence the global Bitcoin market itself.
Final Thoughts
These scenarios are intentionally conservative.
They assume no extreme Bitcoin price forecasts, no expanding mNAV multiples, and no structural advantages beyond what Strategy has already demonstrated. However I do include 1, 2, 3 MNAV calculations.
They simply ask a mechanical question:
If Strategy continues operating within historical ranges, how does BTC accumulation and dilution interact over time?
Small changes in that interaction, especially dilution, have large effects on BTC per share, which ultimately drives equity value.
Ultimately, the long-term value of $MSTR isn’t determined by Bitcoin alone, it’s determined by how efficiently Strategy turns Bitcoin into Bitcoin per share.
Tables - please paste these into the AI of your choice and interrogate as you see fit.

Founding Member
Mike Flaum, known as Grain of Salt, is CEO of Log Scale Investments and a Founding Member of True North. He covers Federal Reserve policy, monetary theory, and macro forces shaping Bitcoin's role as a treasury asset.
Related Research
Strategy is Trading Bitcoin's Power Law Trend
May 19, 2026
AnalysisBitcoin Is Missing a Central Bank. Strategy Is Building One.
Jan 26, 2026
AnalysisSTRC, Bitcoin's Exponential Pump, MSTR to 20k & BTC to 5MM — Money, The Perfect Product
Jan 21, 2026
AnalysisHiding in Plain Sight
Jan 20, 2026
CommentaryThe Original 1,000x — Standard Oil Is Happening Again
Mar 15, 2026
AnalysisBillions of Dollars backed by STRC.
Mar 13, 2026