The Fracture: Breaking Bitcoin's Power Law
Related Research

I. Introduction: What Comes After the Power Law?
Last quarter, with Bitcoin down more than 50% from its high, I argued that bear markets are a feature, not a bug of Bitcoin’s early adoption process. And at the start of this year, I laid out my case for an $11 million Bitcoin by 2036. I still think that case remains possible. However, the more interesting question is what the path from here to there actually looks like.
Early Bitcoin cycles produced 100x moves. More recent cycles have produced much smaller returns. Extend that trend far enough and Bitcoin eventually starts to look like a mature asset producing relatively normal returns.
The power law captures this idea well. Bitcoin has followed a remarkably consistent long-term trend for more than a decade, with returns gradually declining as the asset grows.
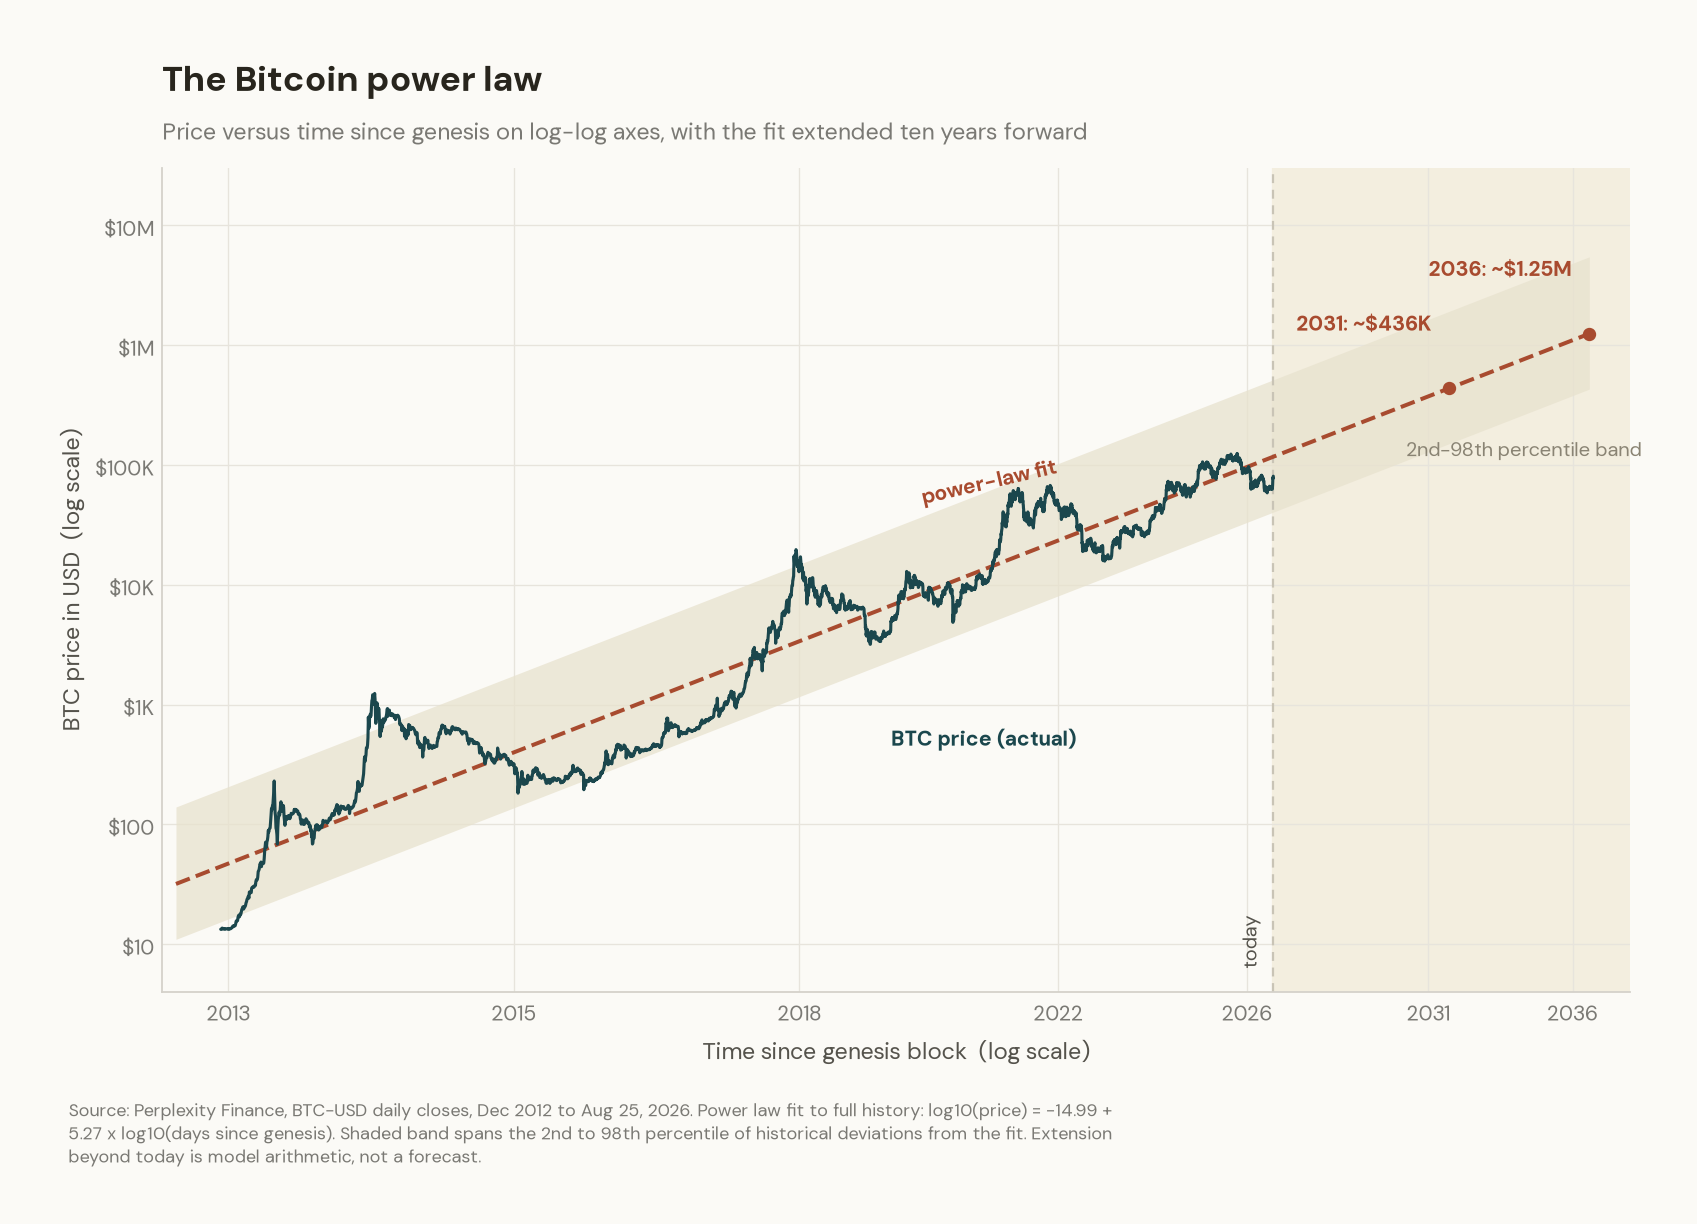
I give the power law framework a lot of credibility. I think Bitcoin could continue following something close to a power law for years. But, I am less convinced that the power law describes the end state.
As Bitcoin matures, returns have declined, but volatility has declined too. Eventually, lower volatility changes how much capital Bitcoin can attract and what Bitcoin can be used for.
Lower volatility improves Bitcoin’s risk-adjusted profile while also making it easier to finance. As Bitcoin becomes high-quality collateral for the global financial system, the amount of dollar-denominated credit that can be created against it could increase dramatically.
Diminishing returns reduce volatility. Lower volatility attracts more capital and increases Bitcoin’s credit capacity. Eventually, those forces could cause returns to reaccelerate again.
I think Bitcoin may ultimately break its power law to the upside.
II. A Curve From Materials Science
There is an interesting analogy from materials science.
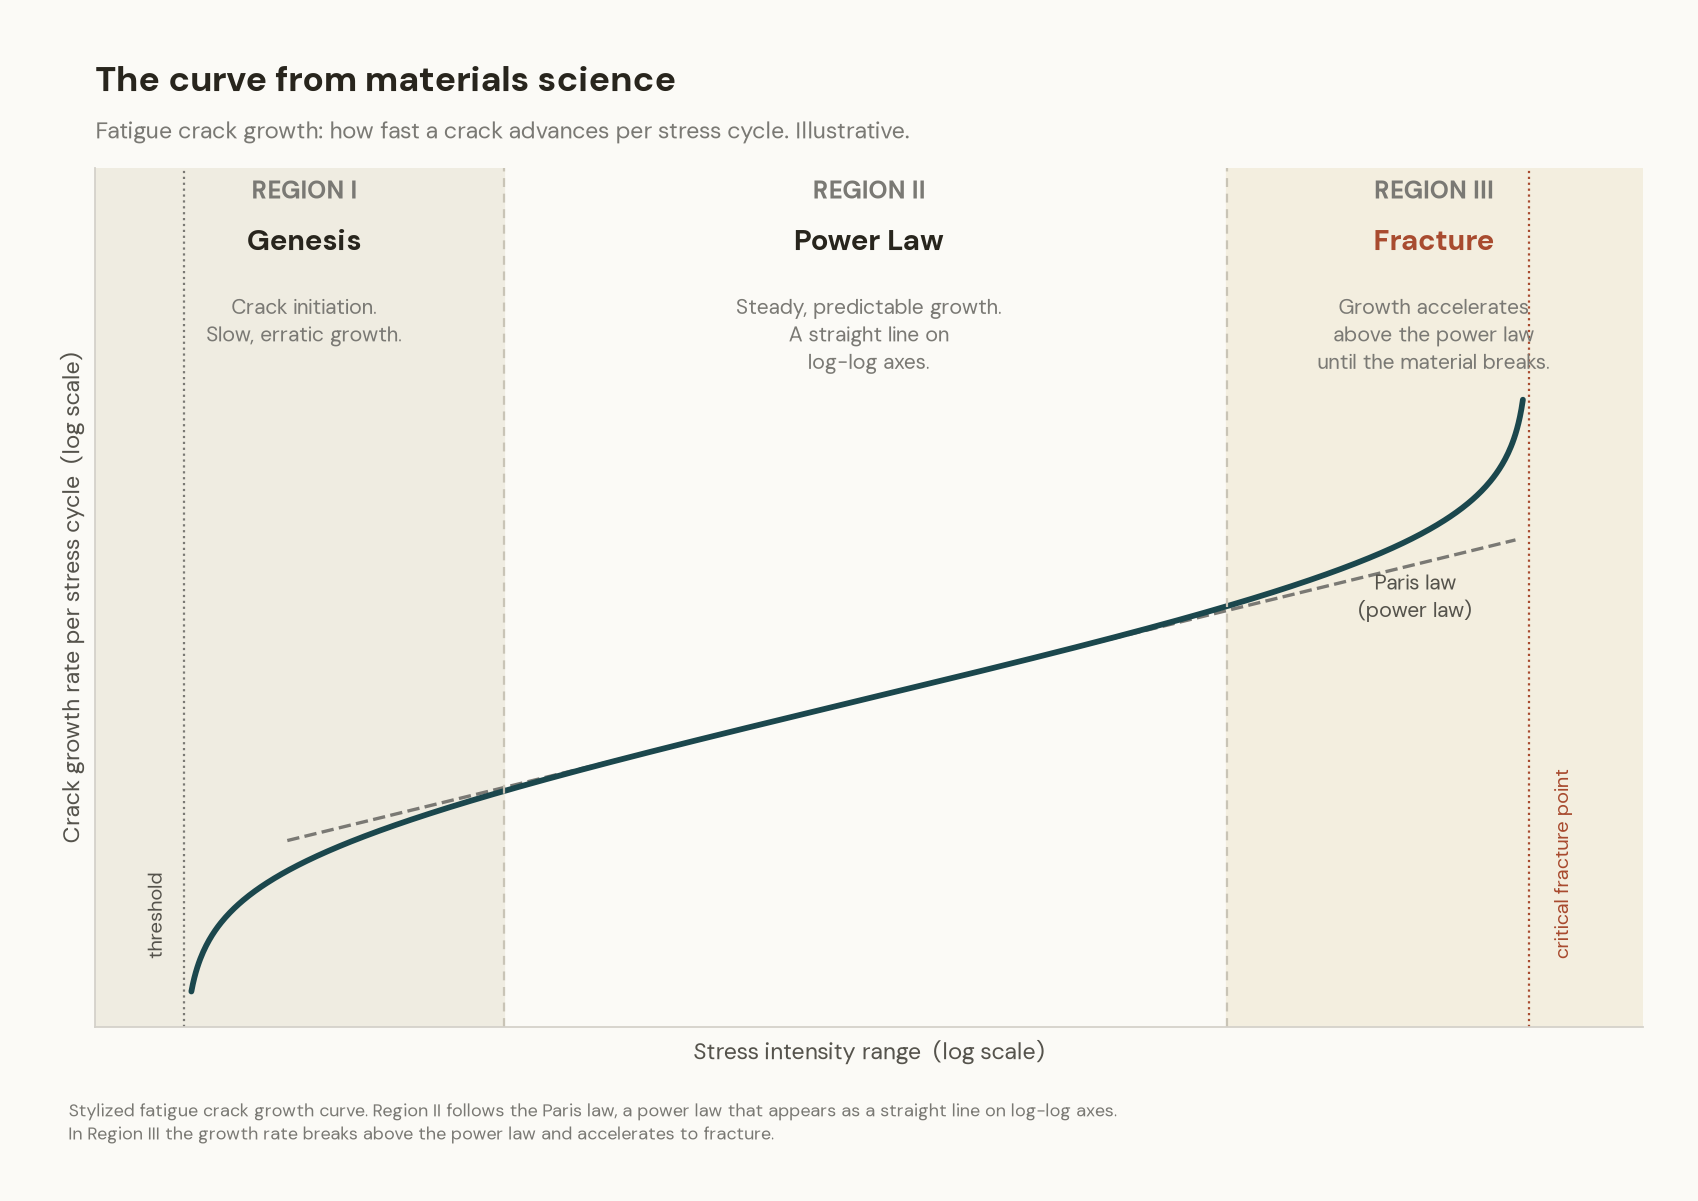
Engineers who study metal fatigue look at how a crack grows through a material under repeated stress. Metal fatigue is the gradual weakening caused by many small, repeated loads. An aircraft wing flexes slightly on every flight. A bridge deck loads and unloads under every truck. Each stress cycle does a tiny amount of damage, the damage accumulates as a growing crack, and engineers plot how fast that crack advances on a famous chart with three regions.
In Region I, the crack is forming. Growth is irregular and difficult to model. In Region II, crack growth becomes much more predictable. Engineers call this the Paris law regime. Growth follows a power law and appears approximately linear on a log-log chart. Then comes Region III. The crack reaches a critical point and begins accelerating rapidly. The power law that described the middle portion of the process stops describing what happens next. The material eventually fractures.
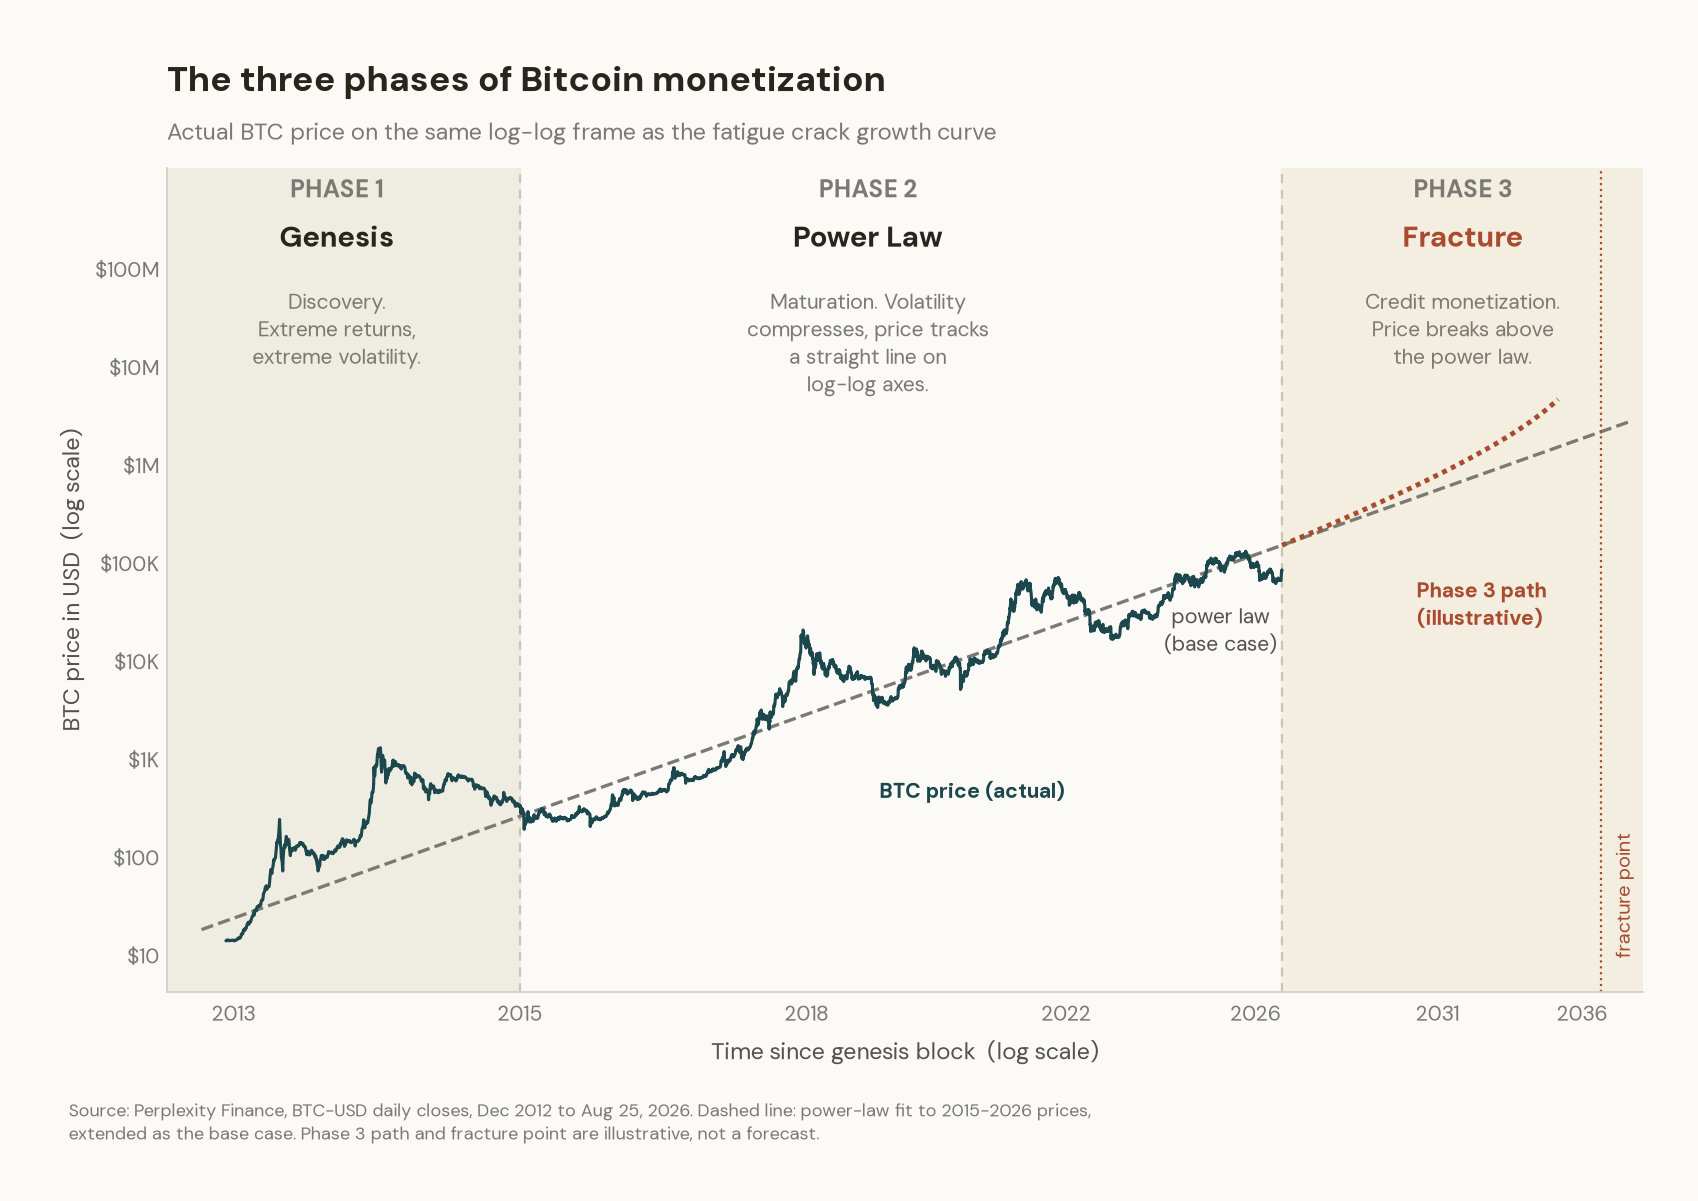
I think Bitcoin’s monetization follows the same shape, with the dollar system playing the role of the material.
Phase 1 is discovery. Returns and volatility are extreme, and Bitcoin remains difficult for large pools of capital to own or finance.
Phase 2 is maturation. Volatility compresses along with returns, improving Bitcoin’s risk-adjusted profile, allowing larger capital allocations, and making it increasingly attractive as collateral.
Phase 3 is financial monetization. Organic capital and credit-financed demand begin flowing into Bitcoin at scale. Reflexivity takes over, and price growth reaccelerates, breaking the power law to the upside.
Most people look at Phase 2 and assume diminishing returns continue forever. I think Phase 2 may actually be what creates the conditions for Phase 3. As Bitcoin matures, volatility falls, its risk-adjusted returns improve, its collateral quality strengthens, and both organic capital and credit-financed demand become easier to deploy.
III. Phase Two Is Measurable: The Volatility Decline
Bitcoin has already become dramatically less volatile.
In March 2014, Bitcoin’s one-year realized volatility peaked near 147%. Today it sits near 44%, per Perplexity Finance data, and Fidelity recently observed that volatility is now lower than on 98.5% of all days in Bitcoin’s history.
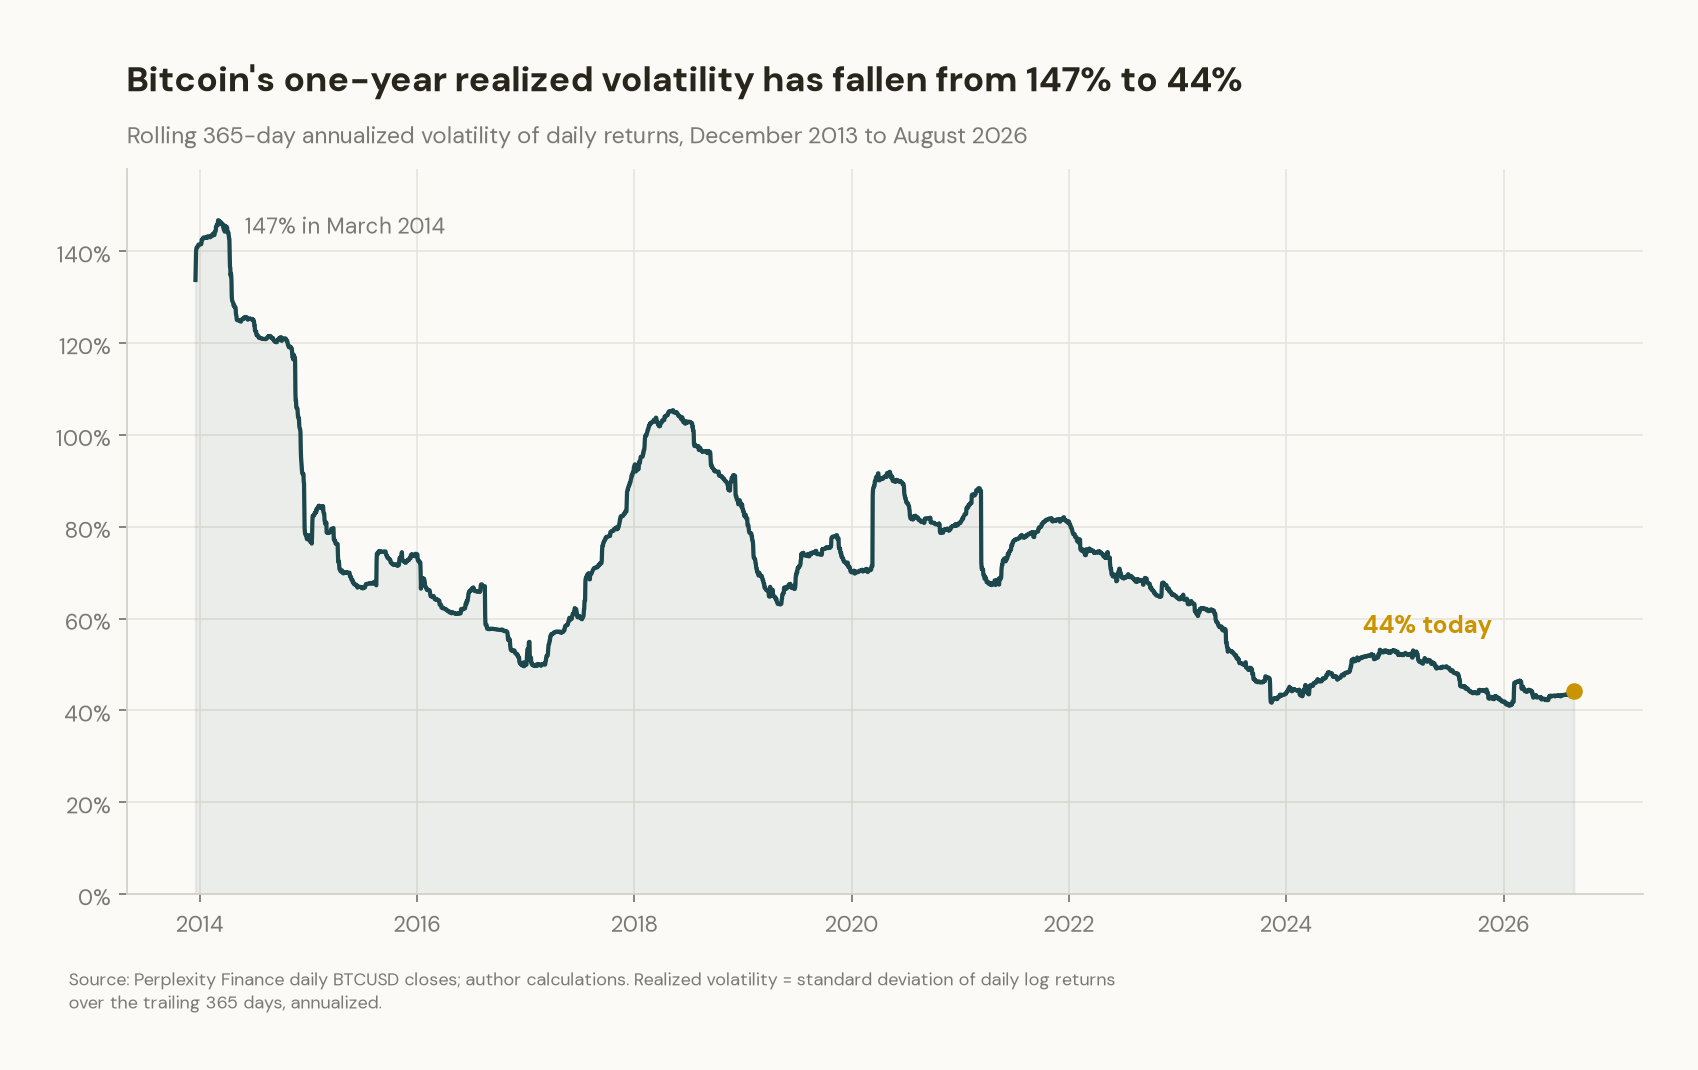
Lower volatility makes Bitcoin increasingly compelling on a risk-adjusted basis. Bitcoin has maintained extraordinary long-term performance as its volatility has fallen, producing an improving Sharpe ratio that can draw capital organically. You could already see this in 2016 and early 2017, when volatility had compressed significantly while Bitcoin’s strong performance began attracting more capital.
Volatility also acts like a tax on position size. For an investor operating within a fixed risk budget, cutting Bitcoin’s volatility in half can roughly double the position they can hold without increasing its contribution to portfolio risk. Lower volatility therefore expands the amount of existing capital that can flow into Bitcoin before a single new dollar of credit is created.
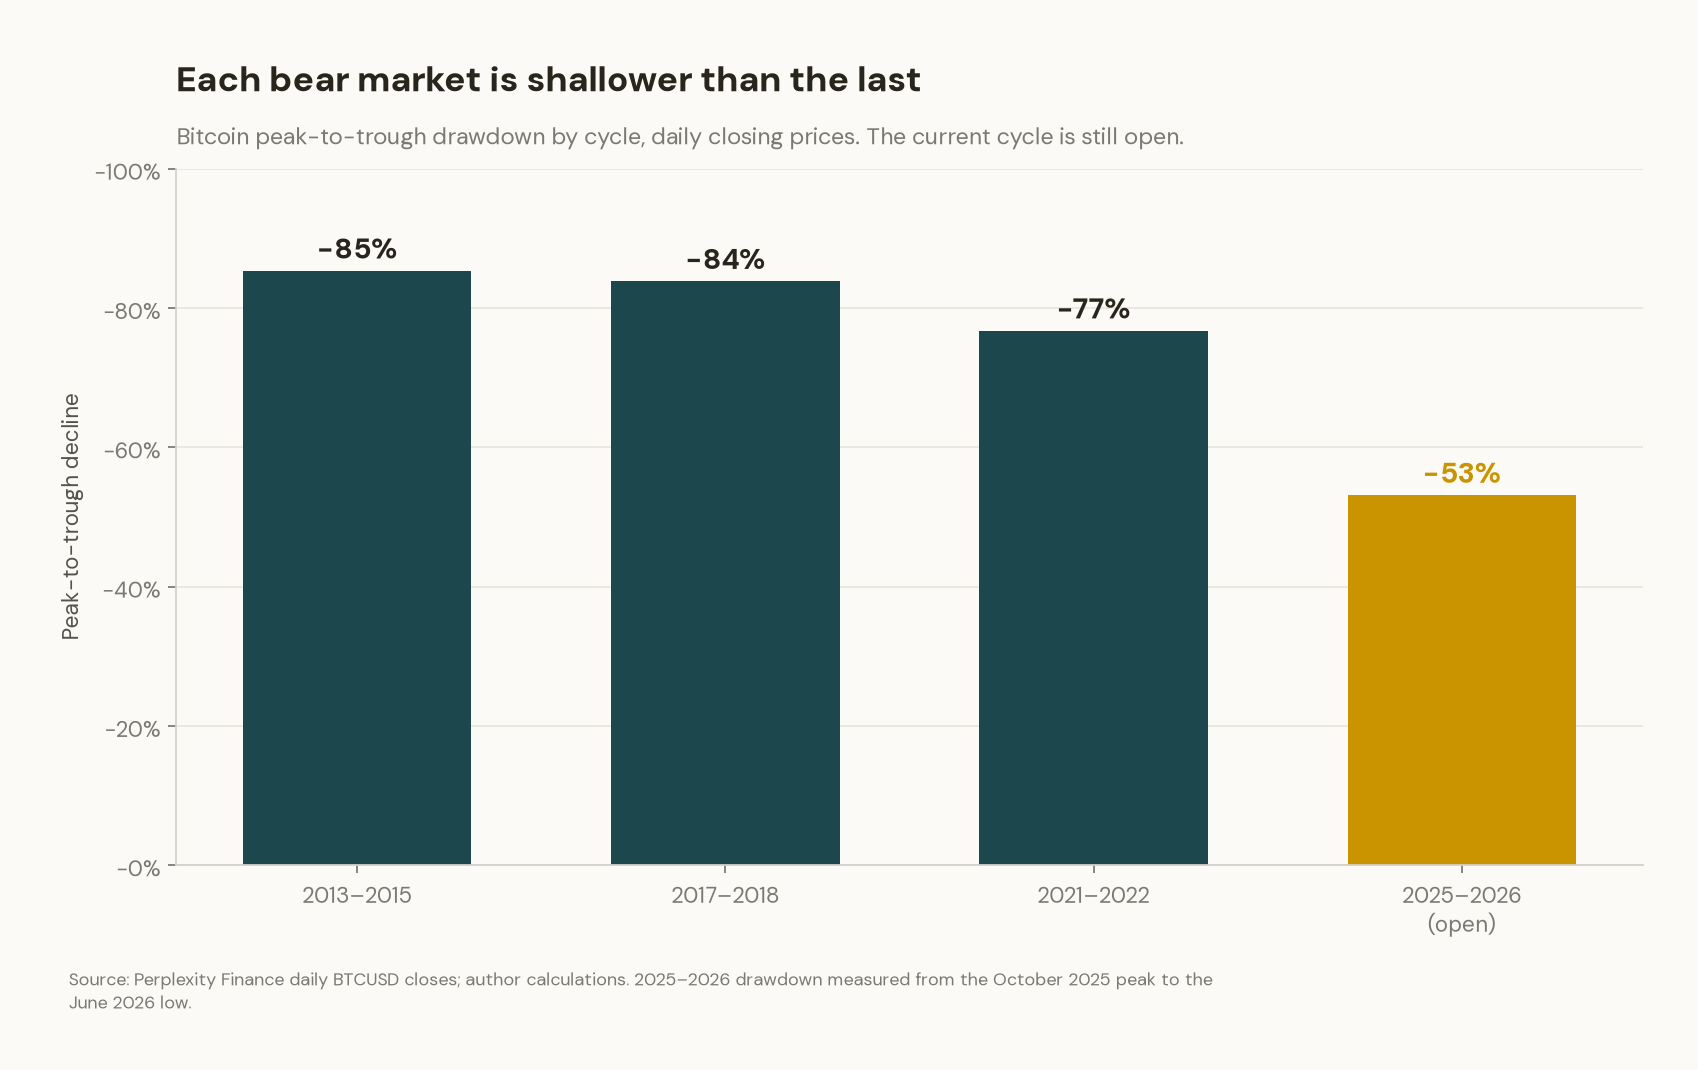
The drawdowns tell the same story. Bitcoin’s first three full cycles produced drawdowns of roughly 85%, 84%, and 77%. The current cycle’s decline, from the October 2025 high near $125,000 to the June low near $58,500, reached about 53%. NYDIG made the same observation at the June low: a 52.7% decline versus 77.6% in 2021-22 and 84-94% in the first three cycles. Each cycle, the floor is higher and the fall is shallower. NYDIG has called this secular decline in volatility one of the defining features of the current era.
For Bitcoin holders, this can feel disappointing. The bull markets are smaller. The bear markets are smaller. The returns are smaller.
For a lender, the exact same trend is extremely interesting. Bitcoin is becoming much better collateral.
IV. Lower Volatility Expands Credit Capacity
Think about Bitcoin from the perspective of someone making a loan. The lender cares about how far Bitcoin can fall before the value of the collateral approaches the value of the loan.
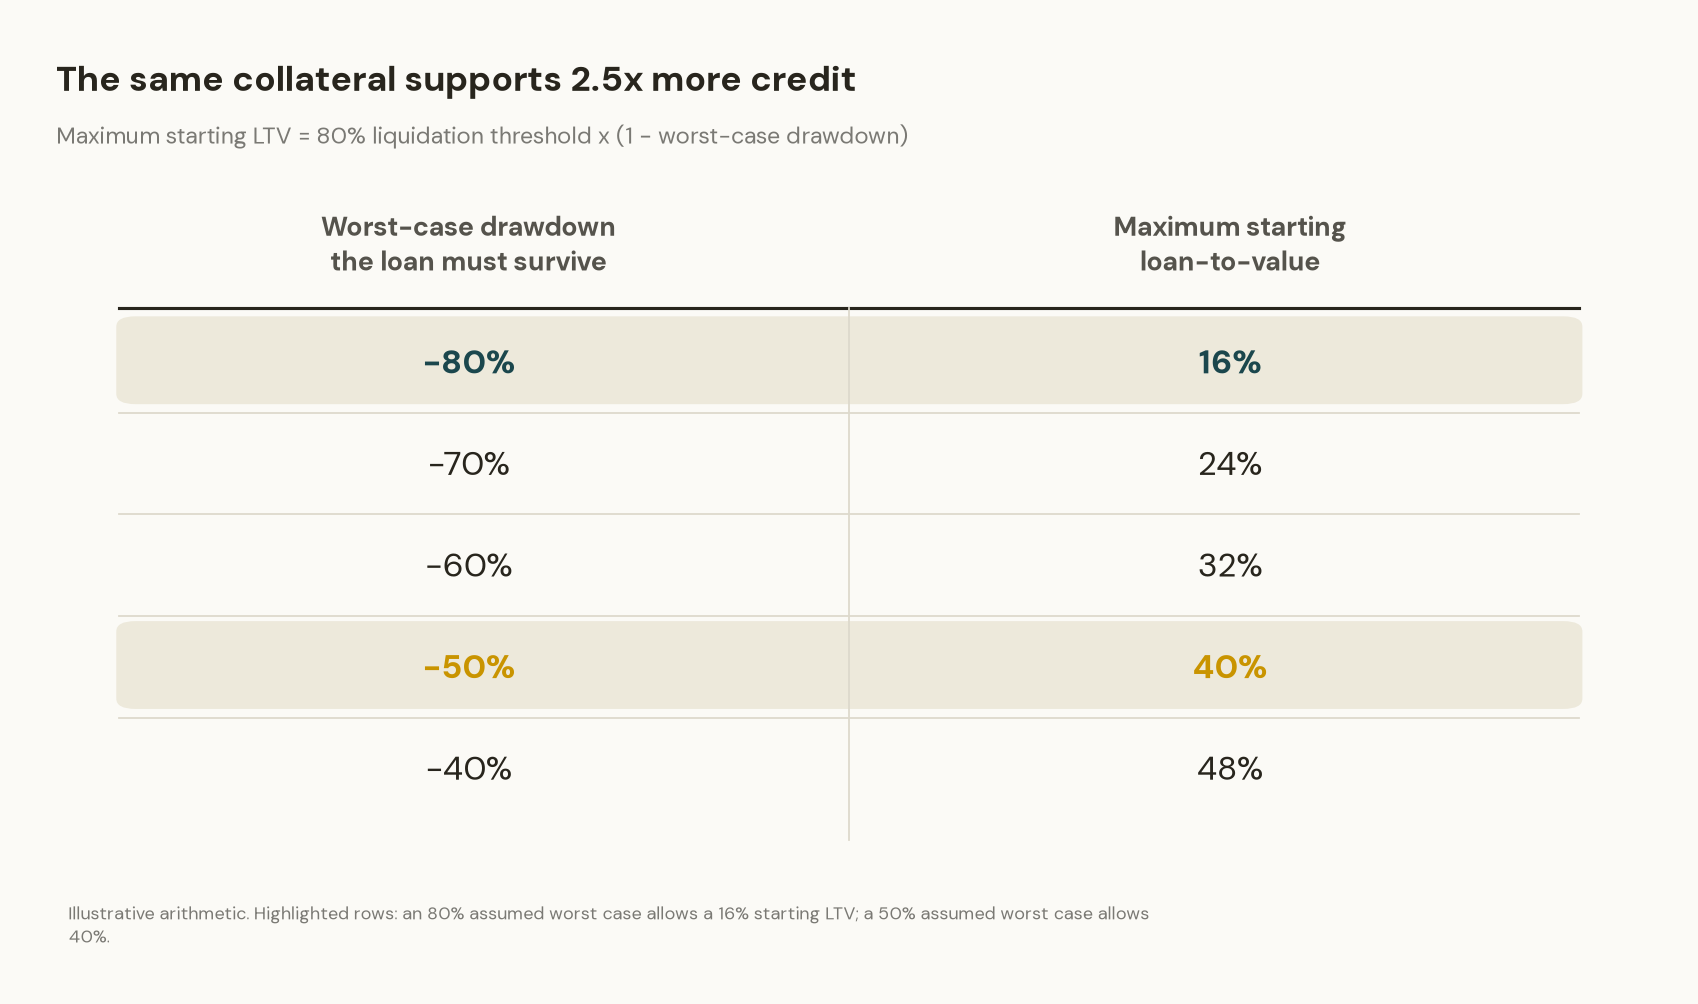
Suppose someone owns $100,000 of Bitcoin and borrows $20,000 against it. That is a 20% loan-to-value ratio, or LTV. Assume the lender liquidates the Bitcoin if the LTV reaches 80%.
The lower Bitcoin’s expected worst-case drawdown becomes, the more money that lender can safely lend against the same collateral. Cutting the worst-case drawdown from 80% to 50% multiplies safe credit capacity by 2.5x with the same liquidation rule.
The same math matters from the borrower’s side. Structures like Strategy and Strive can finance additional Bitcoin exposure without short-term liquidation risk, and shallower drawdowns make those structures more resilient. Lower volatility can therefore support greater amplification while reducing credit risk.
Price appreciation creates another accelerator. If Bitcoin doubles while the dollar credit against it remains unchanged, the LTV is cut in half. The same Bitcoin can suddenly support substantially more credit, strengthening the collateral base that can finance the next round of demand.
And the economics can remain attractive even as Bitcoin’s returns mature.
Bitcoin also does not need to keep producing 100% annual returns for the financing opportunity to become enormous.
Say Bitcoin’s expected return compresses to 30% per year. Finance a Bitcoin position at a 13% cost of capital, roughly where Bitcoin-powered preferreds price today, and that leaves roughly 17% of expected carry.
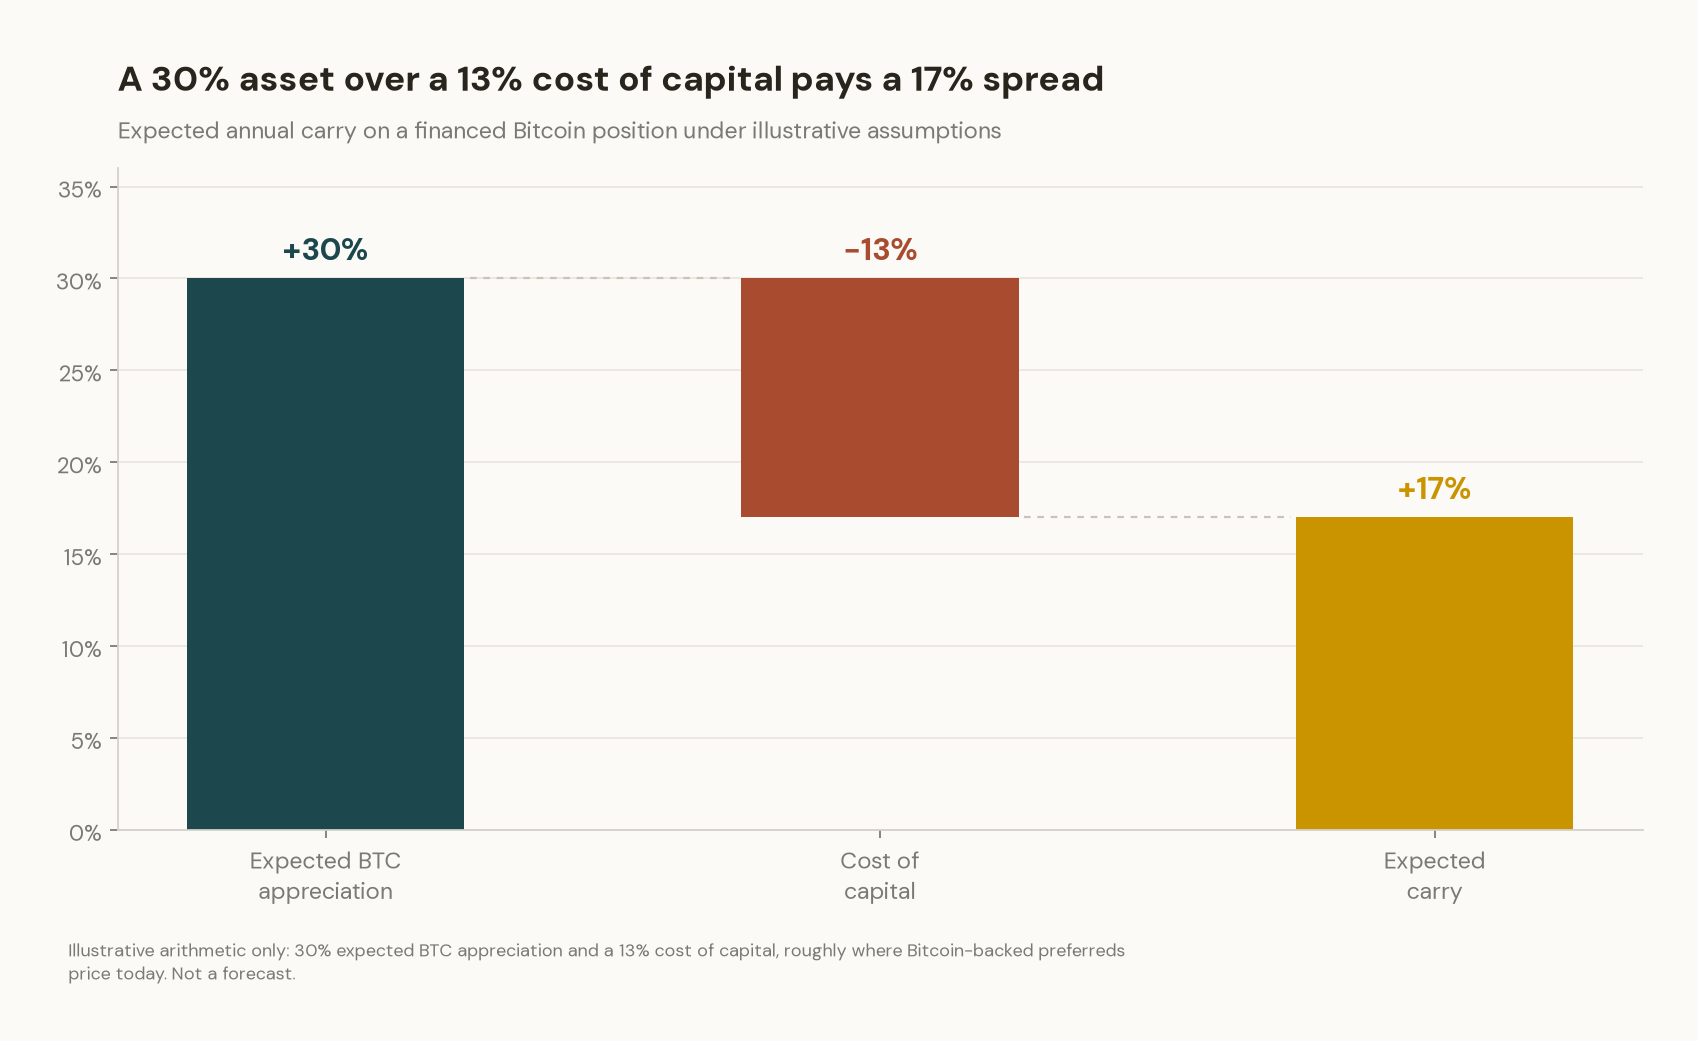
That kind of spread on collateral whose worst-case drawdown keeps shrinking can support a massive amount of credit. As volatility declines, perceived collateral risk should fall and cheaper funding channels can open: bank credit lines, investment-grade bonds, securitized Bitcoin-backed loans.
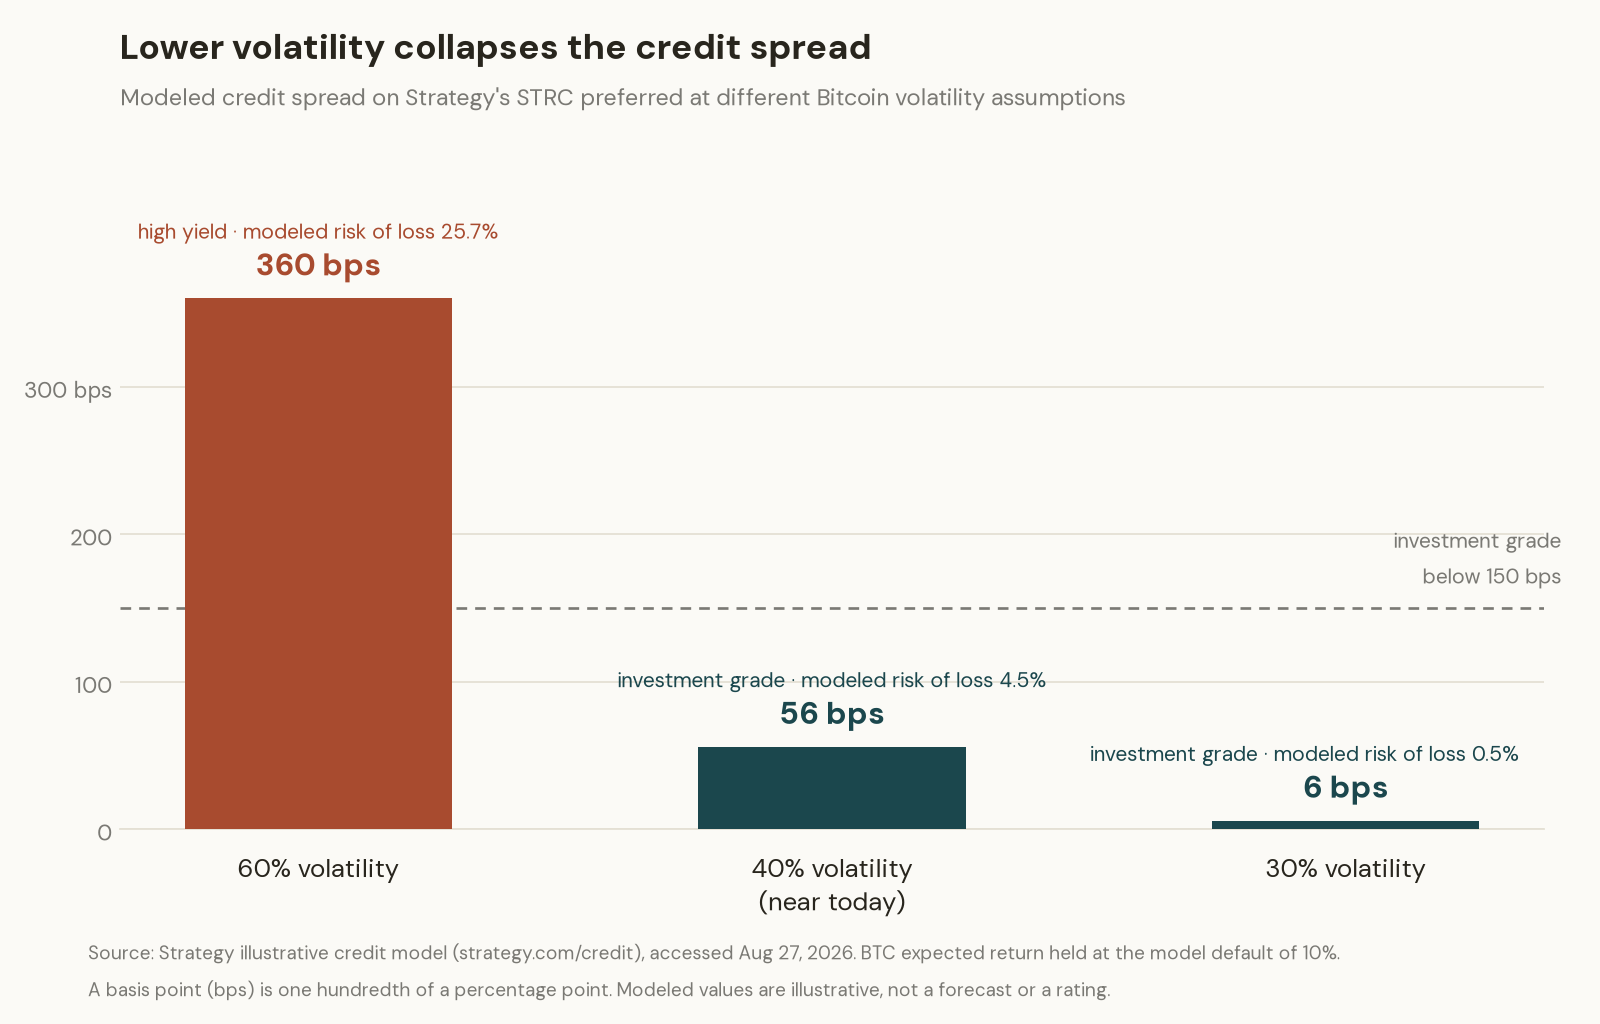
You can already watch this math work in public. Strategy publishes an illustrative credit model that translates assumed Bitcoin volatility into a credit spread on its preferreds, the extra yield investors demand for bearing the risk of loss. Holding its other assumptions constant, the model prices STRC at a 360 basis point spread when Bitcoin volatility is 60%, junk territory. Drop volatility to 40%, near today’s realized level, and the spread collapses to 56 basis points, comfortably investment grade. At 30%, it falls to just 6 basis points, and the modeled probability that the collateral fails to cover the claim drops from roughly 26% to under 0.5% across the same range. Falling volatility turns the same instrument into safer credit, and safer credit is the kind the financial system creates far more of.
Declining returns and declining volatility are the inputs. Eventually, rising returns could become the output.
V. The Loop: Capital and Credit
Put the pieces together and you get a reflexive loop.
Bitcoin grows and matures. Volatility falls. Risk-adjusted returns improve, allowing investors to allocate more capital. Bitcoin also becomes better collateral, making credit cheaper and more abundant. Organic capital and newly created dollar credit increasingly compete for a fixed supply of 21 million Bitcoin. Bitcoin rises. The collateral base grows, supporting still more credit. Then the process repeats.
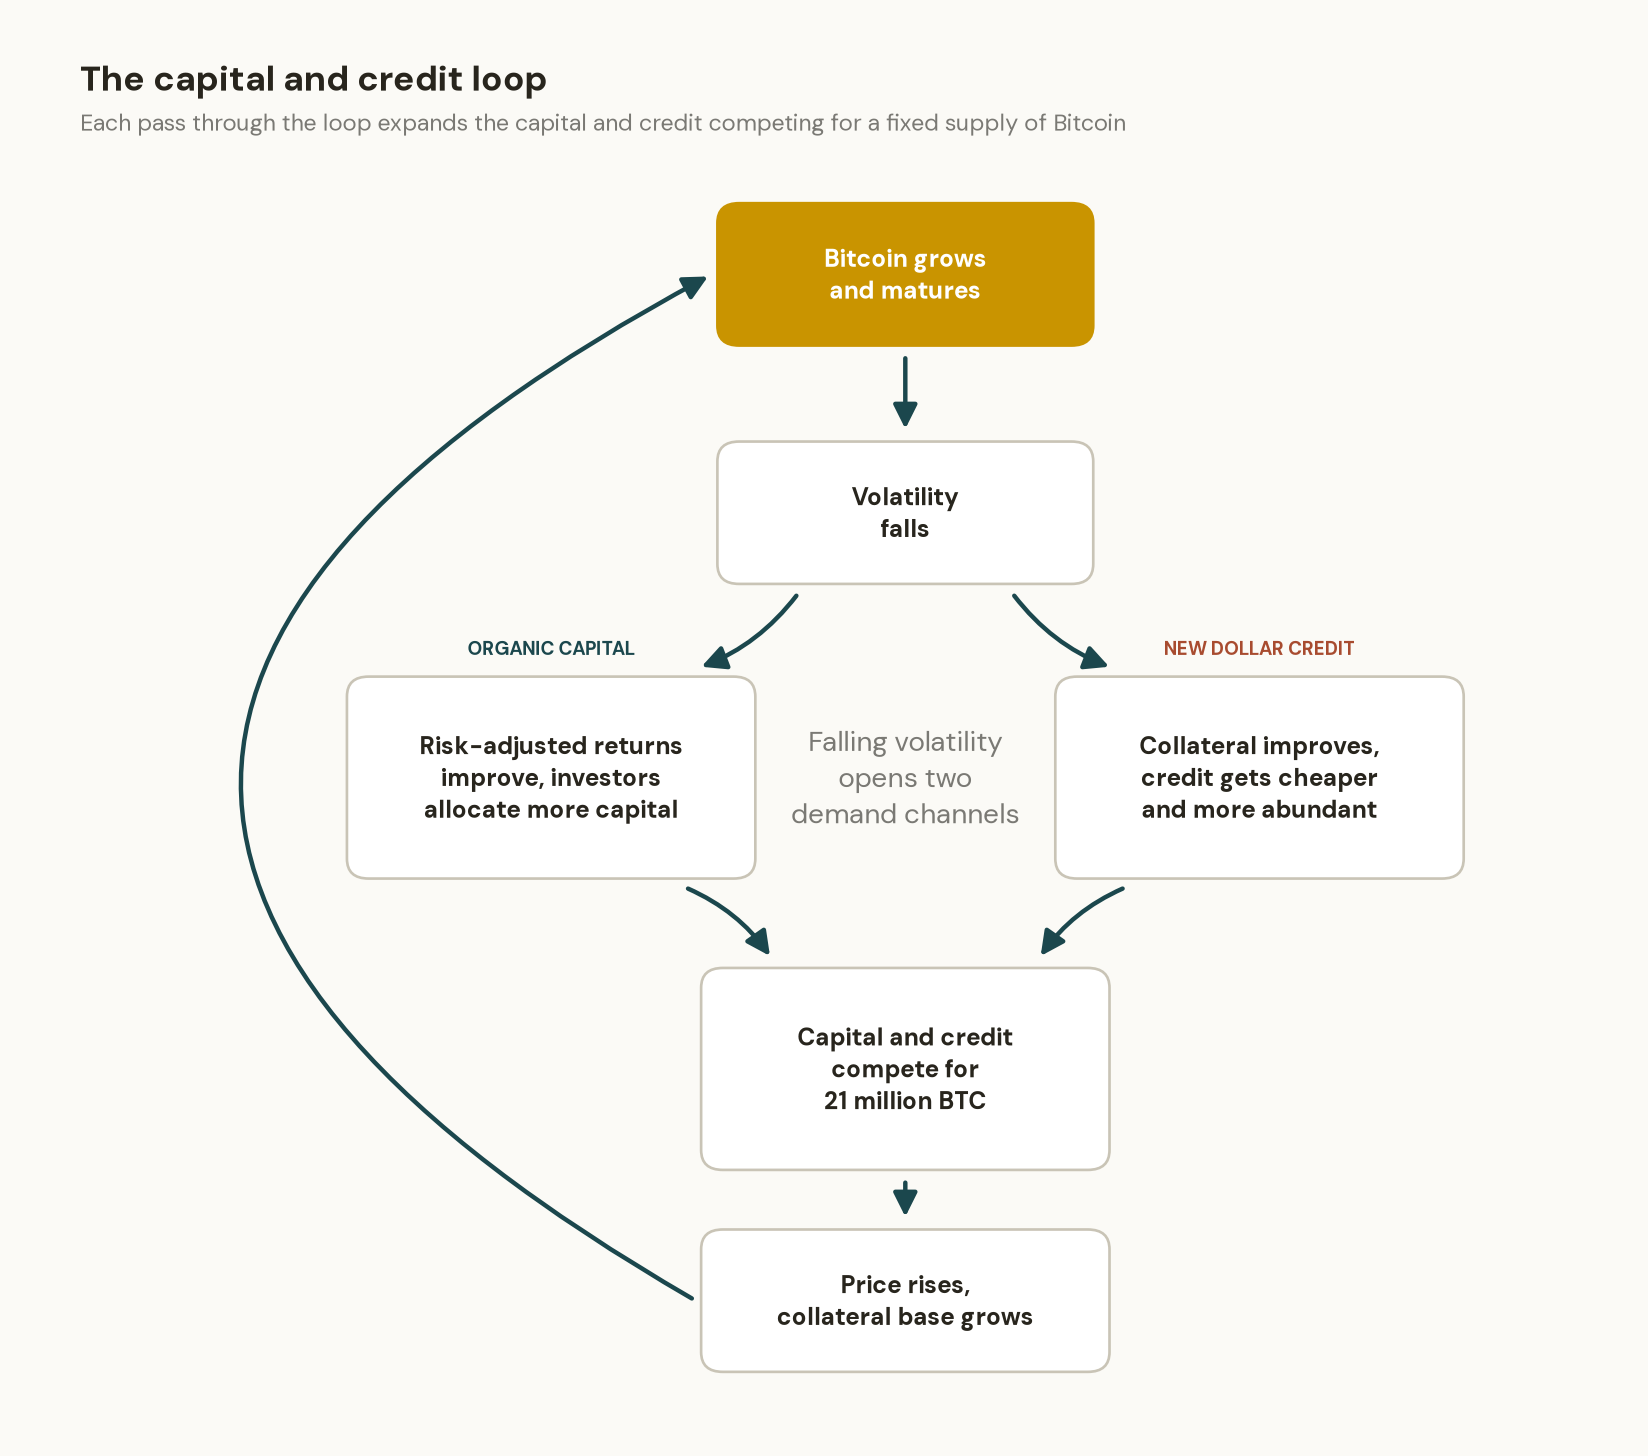
The credit side of this loop resembles a speculative attack: borrow the weaker money, buy the harder money, and it becomes a self-reinforcing positive feedback loop.
The credit creation can arrive through many doors. Banks could make Bitcoin-backed loans, and banks create new dollars when they lend, as the Bank of England has documented in its paper on money creation in the modern economy. Corporations issue convertible bonds and perpetual preferreds to acquire Bitcoin. USD credit is getting created both ways, and every door increases the total supply of dollar credit in the economy while taking more Bitcoin off the market.
VI. Phase Three: Breaking the Power Law
So what does the endgame look like?
Adoption itself almost certainly follows an S-curve, the standard pattern where new technology spreads slowly, then rapidly, then saturates. Many people assume the price chart must follow the same shape and flatten out. That assumption quietly treats the dollar side of the BTC/USD price as fixed.
The number of Bitcoin is fixed. The amount of capital and dollar credit capable of competing for those Bitcoin is not. As volatility falls, more existing capital can justify owning Bitcoin, while Bitcoin’s improving collateral quality allows the financial system to create more USD credit against it. Even if adoption saturates, the amount of capital capable of owning or financing Bitcoin can keep expanding, and the BTC price measured in dollars may eventually reaccelerate above the power-law trend that described Phase 2.
That is Region III on the fatigue curve. The crack does not grow at the Paris-law rate forever. It accelerates into fracture. Falling volatility creates the capacity for more capital and credit, but once that capacity begins competing for a fixed supply of Bitcoin, returns and upside volatility can reaccelerate together.
In this analogy, the material under stress is the dollar-denominated credit system, and the fracture is the moment Bitcoin’s dollar price breaks above the power law.
This letter is for informational purposes only and should not be considered financial, investment, or legal advice. Opinions expressed are my own and do not constitute recommendations. Always conduct your own research before making financial decisions.

VP of Bitcoin Strategy, Strive
Joe Burnett is VP of Bitcoin Strategy at Strive (Nasdaq: ASST) and the host of The Income Show on True North. Previously, he served as Director of Bitcoin Strategy at Semler Scientific.
Related Research
Trust Is Civilization's Oldest Technology
Aug 13, 2026
AnalysisStrategy is Trading Bitcoin's Power Law Trend
May 19, 2026
AnalysisSemi-monthly STRC Divs Will Increase Monthly STRC ATM to $10B
Apr 20, 2026
AnalysisMichael Saylor Broke the Sharpe Ratio with $STRC
Apr 8, 2026
AnalysisSTRC Will Become a Part of Common Investor Vocabulary
Mar 31, 2026
Digital CreditThe Definitive Guide to Digital Credit
Mar 25, 2026