Michael Saylor Broke the Sharpe Ratio with $STRC
Originally published on X
Related Research
Michael @saylor broke the Sharpe ratio. One penny of volatility on $100 is 1BPS(Basis Point or .01%) The Sharpe ratio is not just a generic measure of “how good” an investment is. It is designed to measure how much return an asset generates relative to the risk-free rate, adjusted for how sensitive its price is to movement, which we call volatility. In simple terms, it asks: how much excess return are you getting for each unit of price fluctuation?
Now introduce STRC into that equation. STRC is a preferred equity instrument trading at roughly $100 par, with a variable dividend that currently yields 11.5% annually. The key observation is not just the yield, but the behavior of the price. If you look at the chart, the dividend rate steps higher over time, but the price remains pinned near $100. It occasionally dips or rises by a small amount, but it consistently returns to par. This is not a typical equity, and it is not behaving like a volatile asset. It is functioning more like a controlled instrument, where price stability is a feature, not a coincidence. You are effectively getting a high yield with a price that does not drift significantly away from its anchor.
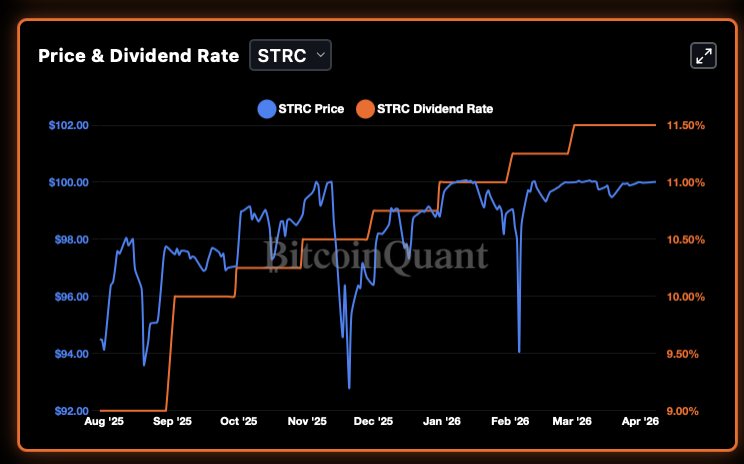

The numerator, the return above the risk-free rate, tends to be relatively stable. The denominator, volatility, is what moves. When volatility is high, the Sharpe ratio falls. When volatility compresses, the Sharpe ratio rises. In the case of STRC, the yield is 11.5%, the risk-free rate is 3.7%, and both are relatively stable. But the volatility is collapsing. As the denominator approaches zero, the Sharpe ratio mechanically explodes higher. This is not optimization. This is the formula breaking under its own assumptions.
The root of the problem starts with a basic misunderstanding that most investors never question, which is the idea that volatility equals risk. People are taught that if something moves around a lot, it is risky, and if it stays stable, it is safe. But volatility is just price movement, not the probability of losing money permanently. Risk is about outcomes, not motion. You can have something that moves a lot and still compounds over time, and you can have something that barely moves and still be dangerous under the surface. The Sharpe ratio assumes that volatility is a good proxy for risk, and that assumption works well enough for most traditional assets. But it is still an assumption, not a law. Once you find an asset where price movement is structurally constrained, that assumption begins to break down, and when it breaks, the metric built on top of it collapses with it.
To understand why this matters, you need to look at what the Sharpe ratio actually is. At its core, the formula is simple. You take the return of an asset, subtract the risk-free rate, and divide by volatility. The numerator is excess return, and the denominator is how much the price moves around. For STRC, the inputs are right in front of you. The yield is about 11.5% annually, paid monthly, and the risk-free rate is around 3.7%. That gives you an excess return of roughly 7.8%. The denominator is volatility, which we can measure across different time frames. So the Sharpe ratio is not measuring return alone. It is measuring how much return you get per unit of price movement. If price barely moves but the yield stays high, the ratio starts to rise very quickly.
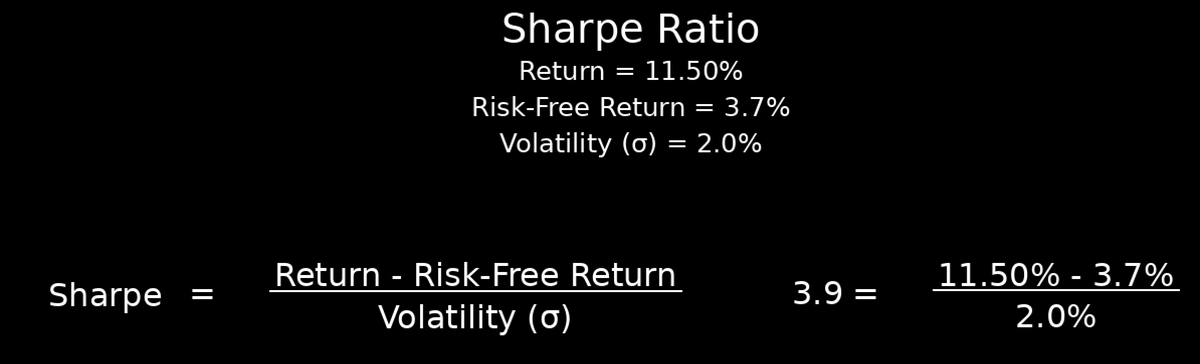
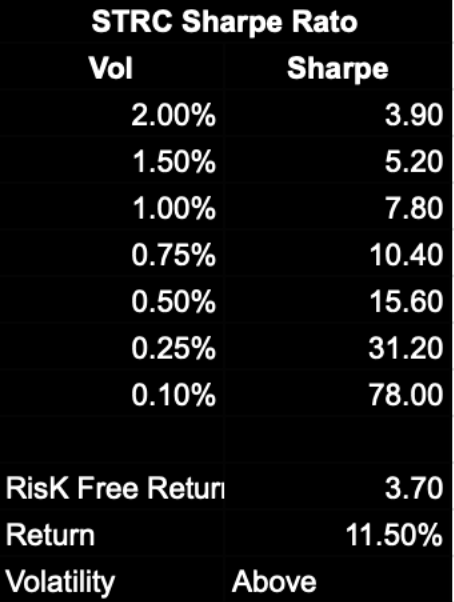
This is where the mechanism becomes obvious. The numerator of the Sharpe ratio, the excess return of 7.8%, remains relatively stable. The denominator, volatility, begins to collapse. As volatility moves from 15% to 3% to 2% and then lower, the Sharpe ratio rises rapidly. At 2% volatility, the Sharpe is around 3.9, which already looks strong. At 1%, it jumps to 7.8. At 0.5%, it goes to 15.6. At 0.25%, it exceeds 30. And at 0.1%, or 10 basis points, the Sharpe ratio approaches 78. At that point, the number stops being useful. It is no longer telling you something meaningful about the asset. It is just reflecting that the denominator has gone close to zero.
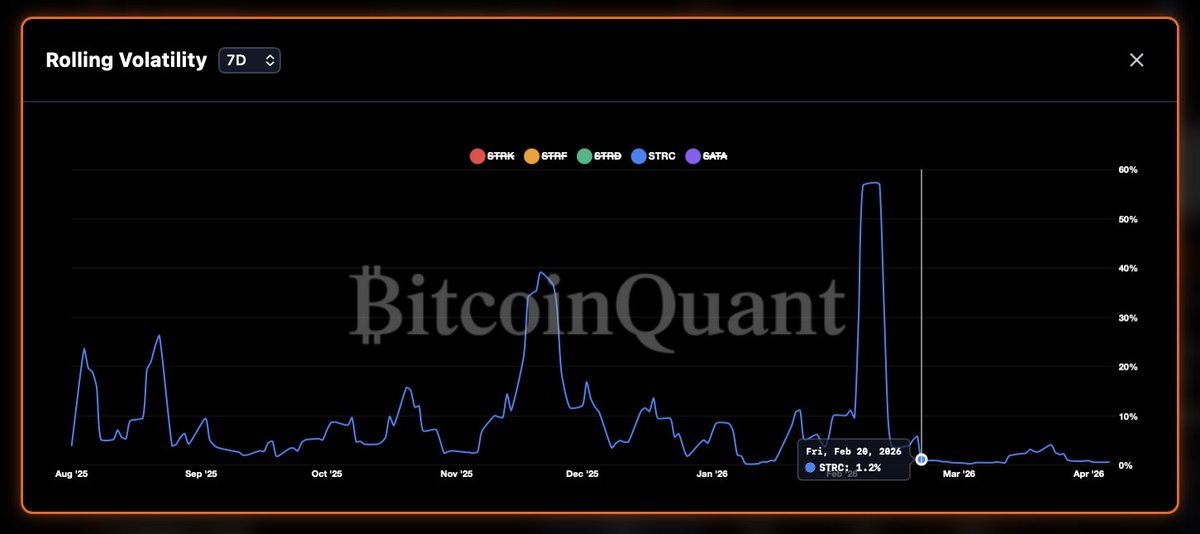
7D Volatility
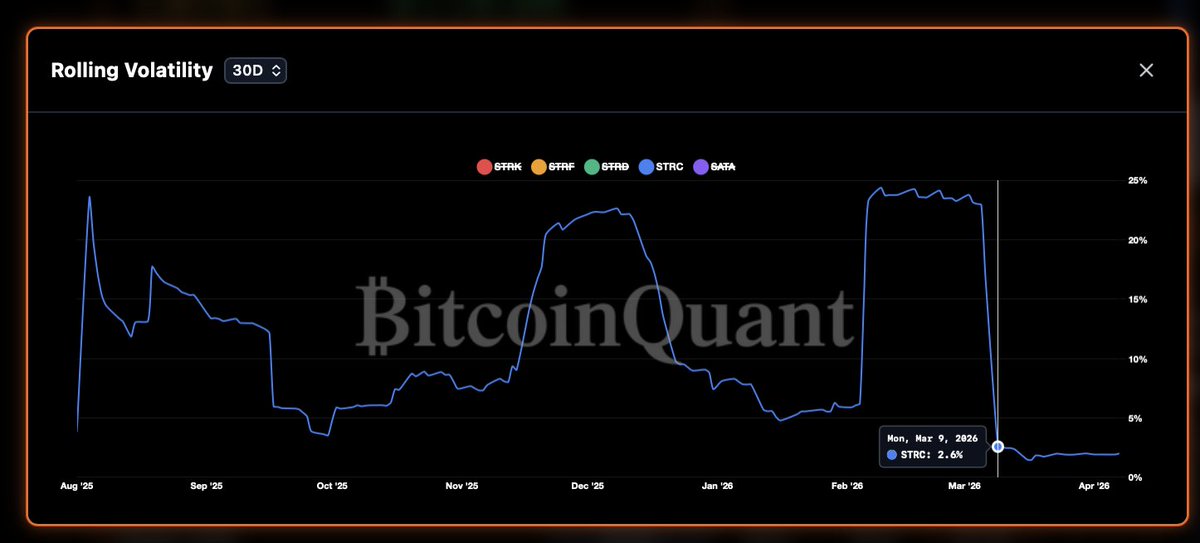
30 Day Volatility
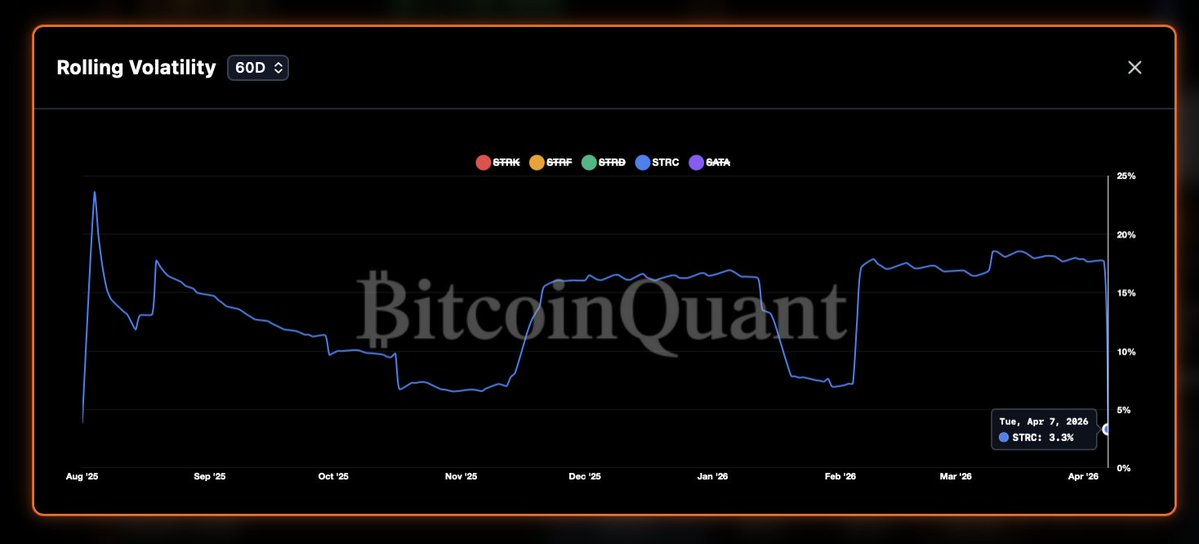
60 Day Volatility
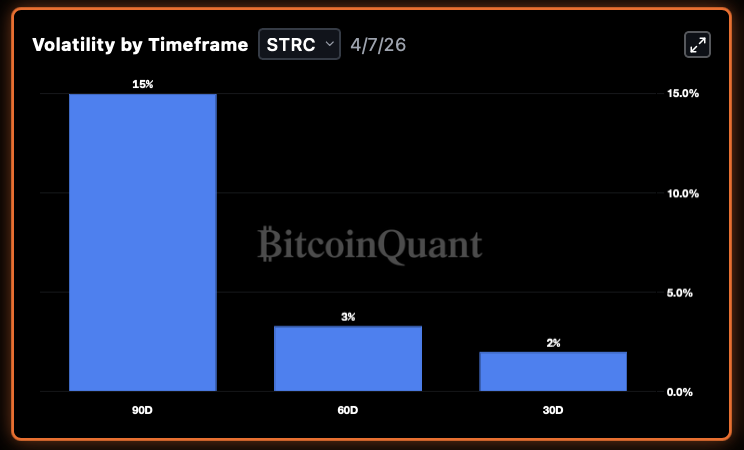
The volatility charts make this even clearer. Over 90 days, STRC might show around 15% volatility, but as you move to 60 days, it drops to around 3%, and at 30 days, it falls to about 2%. The seven-day volatility collapses even further, especially after large spikes roll out of the window. For example, a volatility spike in early February mechanically disappears as you move forward in time, and the rolling calculation resets. This is not random behavior. It is arithmetic. As the high-volatility periods roll off, the measured volatility compresses sharply. By the time you reach shorter windows, the asset appears almost perfectly stable, even though nothing fundamental has changed except the calculation window.
You can see the extreme version of this in Saylor’s own words and the trading data. STRC can trade between $99.99 and $100.01 in a given session, which is literally one penny of movement. That is not normal for an equity-like instrument, but it is exactly what drives the Sharpe ratio higher. When the price barely moves, the measured volatility approaches zero. When the denominator approaches zero, the ratio explodes. This is not alpha. It is math. The Sharpe ratio is doing exactly what it is designed to do, but the environment it is operating in is no longer what it was designed for.
Quick decoder — STRC at $100 par creates a direct mapping:
- $1 = 1% = 100 bps
- $0.10 = 0.10% = 10 bps
- $0.01 = 0.01% = 1 bp
The conclusion is obvious. If an asset can generate a Sharpe ratio of 10, 20, or even higher simply by compressing volatility while maintaining yield, then the metric is no longer useful for comparison or decision-making. It stops being a tool. This is about recognizing that the framework used to evaluate STRC no longer applies. Saylor did not just optimize the Sharpe ratio. He exposed its limits. When the denominator goes to less than 1, the ratio stops mattering, and when the ratio stops mattering, the model behind it has already broken.
But that is only half the story.
STRC is not breaking Sharpe by accident. It is breaking Sharpe because it is not behaving like a traditional asset at all. It is functioning more like a capital allocation tool. Capital flows into STRC, and instead of expressing price discovery through volatility, it is converted into a stable instrument that delivers yield while anchoring price near par. That changes what you are measuring. You are no longer observing a market trying to find equilibrium. You are observing a mechanism that absorbs capital and redistributes it in a controlled way.
Sharpe assumes you are evaluating an asset competing in an open market. STRC is not competing on those terms. It is sitting one layer above that, acting as a conduit where capital can be deployed, stabilized, and monetized. Once you understand that, the high Sharpe ratio is not impressive it become irrelevant. The metric is not telling you something extraordinary about performance. It is telling you that you are using the wrong tool to measure what this actually is. No current metric exists.
This is bullish for $STRC, $MSTR, and Strategy.

Founding Member
Mike Flaum, known as Grain of Salt, is CEO of Log Scale Investments and a Founding Member of True North. He covers Federal Reserve policy, monetary theory, and macro forces shaping Bitcoin's role as a treasury asset.
Related Research
Flow-Adjusted Yield (FAY) for $STRC and $SATA
Apr 8, 2026
CommentaryStrategy Q1 2026 Earnings Call — Full Q&A Notes
May 5, 2026
AnalysisThe Income Statement Is the Obituary. The Balance Sheet Is the Will.
Apr 20, 2026
AnalysisSTRK at $400 will Dominate Strategy's Trading Volume
May 1, 2026
AnalysisSemi-monthly STRC Divs Will Increase Monthly STRC ATM to $10B
Apr 20, 2026
CommentaryThe Original 1,000x — Standard Oil Is Happening Again
Mar 15, 2026